

Cars that hold their value: part 2
We love number crunching here at HPI, and we especially love to see how different cars compare when it comes to running costs and depreciation. As we’ve written before, many buyers assume that rival cars cost much the same to run and that they lose value at much the same rate, but nothing could be further from the truth. Working with and presenting data is what we do, and our latest tool allows you to compare depreciation levels of just about any car currently on sale as well as those on sale three years ago. As you can see on our tables and graphs below, not only have we predicted how much value will be lost by each of the mainstream cars currently on sale, when they reach their third birthday in 2022, but we’ve also logged what every car registered in January 2016 will be worth in 2022 when they reach their sixth birthday. The latter takes into account actual depreciation over the past three years and predicted depreciation over the next three years. As you’d expect, it makes fascinating reading. City cars The tool allows you to search by make, model and derivative, or by market segment. With almost 7000 cars in there we’ve covered everything from the very affordable to the very aspirational. For this article we’ll focus on the former and we’ll kick off with the smallest vehicles of all: city cars. At the top of the pile is the Abarth 595 Turismo, a new example is expected to retain an impressive 48.6% of its value over the next three years; and a 2016 example is expect to retain 28.8% of its value by the time it’s six years old. To put the Abarth’s performance into context, at the other end of the spectrum is the Peugeot 108 1.0 Allure which should retain just 31.4% of its value when 3 years old. While this might seem like a rather poor performance, it’s closer to the norm than the Abarth because most mainstream cars lose value quite quickly. The Abarth performs so well largely because it’s a hot hatch made in small numbers, so it’s something of a collector’s piece. However, the Kia Picanto is very much a mainstream car and in 1.0 Wave form it’s not far behind the Abarth; we reckon it’ll be worth 47.1% of its new list price when it’s three years old. Intriguingly, the top 20 city cars list is dominated by Abarths (595 and 695), Kia (Picanto) and the Ford Ka+. While the latter two sell in big numbers, they both have a keen following which keeps values high. You don’t have to drop very far down the table to see retained values drop quite sharply. Go down a few dozen entries and the retained values are around 40% for cars such as the Skoda Citigo, Toyota Aygo and some versions of the Fiat 500. What’s interesting is that at 38.5% is the Ford Ka+ diesel, whereas its petrol-engined counterparts retain more like 45% of their value after three years. While this may be down to less demand for diesel, much of the higher level of depreciation will be down to the car’s higher list price when new. Superminis A posh badge and a bit of luxury will work wonders for a car’s retained value. An all-new Audi A1 has recently been launched, and according to our calculations this model dominates the top end of the supermini segment over the next three years, when it comes to retained value. Only petrol-engined cars are available and whichever one you buy it’ll retain around half of its value over the next three years (and as much as 53.6% in the case of the A1 25 TFSI SE), which is especially impressive when you consider that at the bottom of the table the retained value is more like 25-30%. Perennial demand also leads to limited depreciation, which is why the Ford Fiesta also retains around half of its value at 3 years old – at least in 1.5 Ecoboost form. Ford may not be a premium brand, but its cars are often some of the most talented in their respective segments, and that’s definitely the case where the Fiesta is concerned. Not far behind is the Mini, which holds on to as much as 47.6% of its value (for the Cooper S Sport II) – although this drops to 40.1% for the Mini One Classic in automatic form. Once again this shows how a bit more power and luxury can have a very positive effect on depreciation rates; entry-level cars often lose a greater proportion of their value than their more upmarket equivalents. Small family cars Known as the lower medium segment in the trade, the small family car sector is the most popular across the whole of Europe. If minimal depreciation is key to you as a buyer, it’s the Toyota Prius that you need to put on your shopping list as this is worth up to 60% of its new list price after three years. The Prius is a car with an emphasis on low running costs, so it’s interesting that the car that gives it the toughest time in our tables is the new Mercedes-AMG A35 – a car with a focus on performance and luxury. Buy an A35 and the retained value will be as much as 58.7%. However, if you buy one of the more mainstream editions this figure can be cut to as little as 46.7%. While 46.7% may be less desirable than 58.7%, in the grand scheme of things it’s still impressive – not least of all because the cars at the bottom of the table are sitting at 25% or so. Or to put it another way, whereas the Mercedes A-Class is expected to retain around half of its value over the next three years, some variations on the Fiat Tipo, Skoda Rapid, Seat Toledo and Peugeot 308 model ranges will lose more like three-quarters
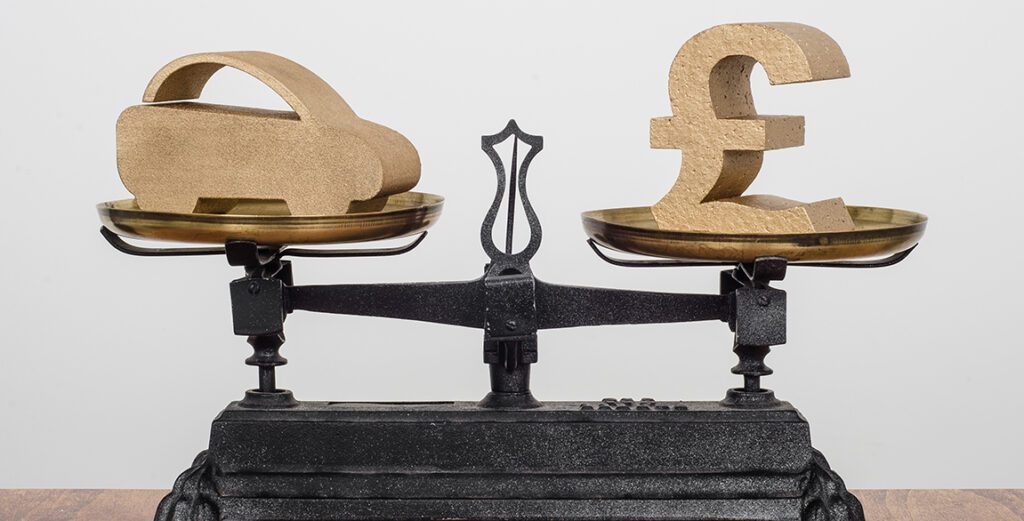
The real costs of running a car

There are many costs associated with owning a car, and many are often overlooked. It’s important to understand and consider all costs, before you commit to buying a car.
Two-Thirds of UK Drivers Admit to Speeding: Are You One of Them?
The rules of the road are there for a good reason – to keep everyone safe on the UK’s highways: cars, pedestrians, cyclists and more. Many of the rules in the Highway Code are legal requirements too, so breaking them is a criminal offence. Yet, it’s not unusual for drivers to think it’s OK to break certain rules – despite the threat of fines, penalty points or worse. Speeding is one of the most common motoring offences in the UK, but how many drivers are guilty of speeding regularly? At HPI, we decided to find out… Speeding: How Common Is It? Not even the introduction of heavier speeding fines in 2017 (as reported by Sunday Times) has quelled the need for speed for more than two-thirds of UK drivers. Our survey found that 68% admit to driving too fast on some journeys; the remaining 32% denying speeding altogether. For more than a quarter of drivers (28%), exceeding speed limits happens during at least half of their journeys. A further 5.4%, meanwhile, admit to speeding in every journey they make. That’s equivalent to more than 1.7 million drivers. Our survey showed that men are more likely to speed all the time, with 18-to-24-year-olds being the most popular age range of speeders. With so many seemingly willing to ignore speed limits, however, how many are caught doing so? The answer, according to our research, is two-thirds (65%), with temporary cameras the most common way to catch speeders – followed by static cameras. Being pulled over by the police, meanwhile, is how 8.5% of male and 2.9% of female speeders were caught. Norwich: The UK’s Speeding Capital With almost 3 in 10 of its drivers speeding 90%+ of the time and 14.8% admitting they’d speed during every car journey, Norwich is the speeding capital of the UK. Newcastle, meanwhile, is home to the UK’s safest drivers – with 50% of its drivers claiming they’ve never sped before. The most common way that speeding cars are caught varies by location too. A speed van is most likely to catch you in Glasgow, whereas static cameras are most effective in Leeds. Bristol is where you’re most likely to be flashed by temporary cameras, while don’t be surprised if it’s the police who catch you speeding in Liverpool. And for speeders in Southampton? Well, you’re not likely to know how you’ve been caught! It’s not all about speeding, however. Our research has also found out what deterrents work best for slowing cars down. From speed bumps to changes to the road and vehicle-activated displays, there are plenty of initiatives helping make our roads safer. Where Are Drivers Speeding… and Why? If you thought motorways or dual carriageways would see the most cases of speeding, 2017 data from the Department for Transport (DfT) might surprise you. Just 9% of drivers sped on dual carriageways, while less than half of drivers did so on motorways. In fact, it’s more likely drivers will speed where there are lower speed limits. Nearly 9 in 10 drive too fast in 20mph zones (86%) – half of whom go above the limit by 5mph or more. In 30mph zones, more than half of drivers drove above the limit (52%). Our research also looked at the time of day that drivers are most likely to speed. Emptier roads between 4am-5am make it the most likely time to speed, whereas the least likely time is during the evening rush hour. DfT Statistics in the Real World To put the DfT data to the test, we did our own experiment – hitting the streets between 11am and 1pm to cover the lunch break, the team monitored different road types for 15 minutes at a time. And, it was found that the results of our test echoed the official figures. The number of cars speeding by location: Residential area (20mph) – 92% Country road (30mph) – 34% Single carriageway (60mph) – 13% Motorway overpass (70mph) – 2% The most shocking aspect of our findings is that nearly all vehicles driving through a 20mph zone near a school were speeding. With this zone in place for safety reasons, driving too fast here could be particularly dangerous during break times or at the end of the school day. It’s hard to ignore the risks of driving too fast. The DfT figures found that speeding was a cause in 5.1% of motoring accidents in 2016. And that figure rises to 15% when looking at the number of fatal accidents. Despite these sobering statistics, most motorists are willing to admit to speeding. Do drivers put too much faith in car safety features? Or is it over-confidence? Whatever it is, motorists aren’t being put off breaking one of the most integral rules of the road. If you’re interested in similar motoring topics, please feel free to bookmark our blog.
What makes drivers angry?

What gets Britain’s drivers angry? We carried out a survey to find out why they lose their rag, how this anger affects them and what they do about it.
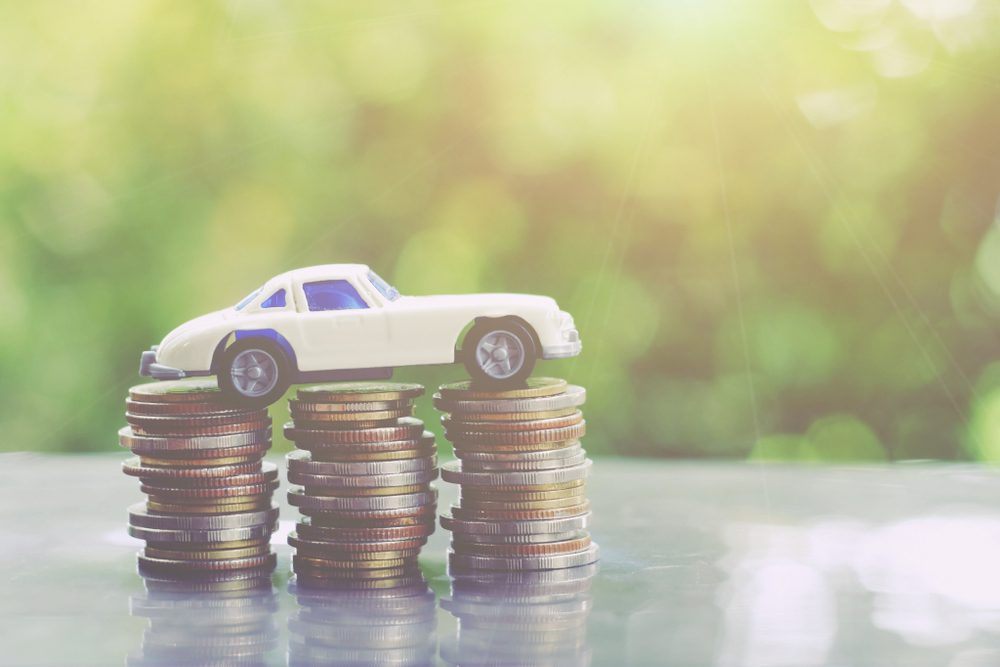
Which cars hold their value?
What are the top 20 cars that have held their value since 2010.
How to be a better driver

What makes a good driver? Is it mindset, skill or knowledge? What’s the two second rule? How well do you read the road?
Digidentity Helps London Residents Safeguard Against Identity Theft During Self-Assessment

With identity theft on the rise and data privacy top of mind, there’s never been a better time to create a secure digital identity.
Insight: the realities of car ownership

We recently did a survey into car ownership it threw up some fascinating results…
The fastest-selling used cars in the UK

Use our new free tool to find the 5 fastest selling cars in a specific UK region along with their average selling prices.
The value of a service history
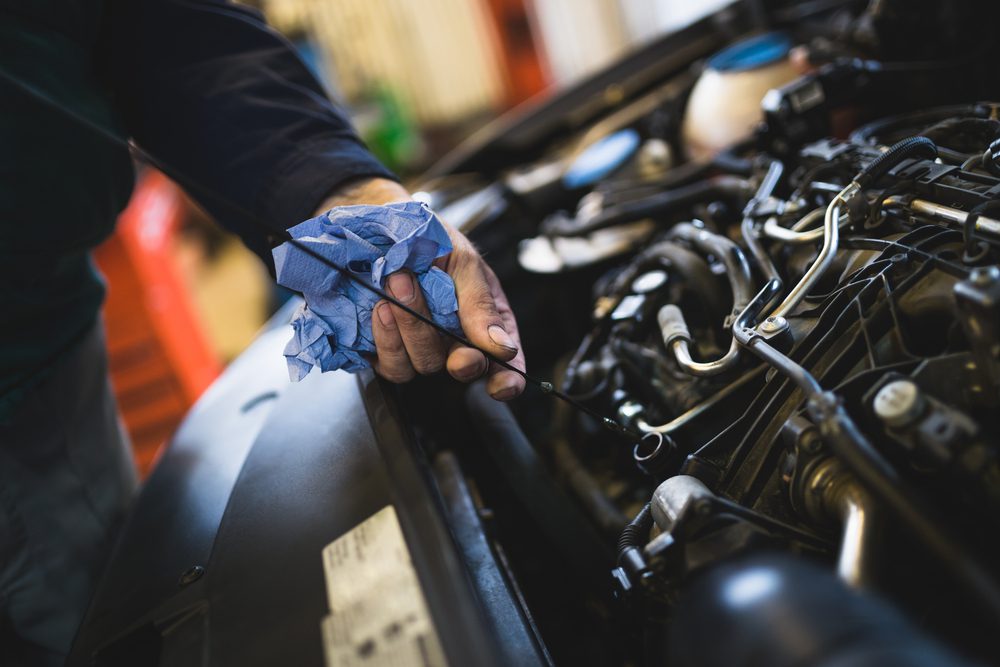
How important is the service history when it comes to buying or selling a car. How is the car’s value affected and what kind of service history should it have?